Here you can find use cases, as well as tips and cookbooks on how to install and operate AstrOmatic software. |
Tuning up your display for optimal viewing of astronomical images
 |
Displaying in a proper and consistent way deep-sky astronomical images on a computer screen is not as straightforward as it seems, even with recent monitors. Much of the fine image details lie in the dark part of the images, whose brightness can hardly be pushed up without ruining the global visual impression, exacerbating the background noise, or overexposing bright regions. Depending on the screen model and the amount of ambient illumination, these dark parts may appear either washed out or totally black. |
Choosing the right LCD technology
 Dark shade fidelity is still LCD monitors’ Achilles heel. The rendering of the cheapest models, based on twisted nematics (TN) liquid crystal technology, varies particularly strongly with viewing angle and must be avoided for preparing astronomical image media. Unfortunately most laptops are equipped with TN panels. LCD monitors based on IPS, MVA and PVA technologies offer consistent rendering on much larger viewing angles, albeit being more expensive and more power-hungry.
Gamma correction
Another issue is gamma correction. It is often forgotten that the true light intensity $I\,’$ (or more formally, radiant emittance) displayed by a properly adjusted display device is related to the pixel value $p$ stored in the computer’s frame buffer through the power law
| $$ I\,'(p) \propto p^\gamma, $$ | (1) |
where $\gamma$ is what is called the display “gamma”: this operation is sometimes called “gamma expansion”. It must be checked that the monitor gamma expansion is correct over the whole dynamic range, and more specifically for the dark shades. The display gamma for computer monitors is generally assumed to have a value of 2.2 nowadays, although in practice it may vary from about 2.0 to 2.5. This exponent between the video signal amplitude and the display light intensity comes from the times when Cathode-Ray Tubes (CRTs) were ruling the world of electronic imaging. For that matter, the inverse relation (“gamma compression”) applies to most electronic image and video storage formats, including old analog ones like Laserdiscs and video tapes. It also applies to the data stored in popular such as JPEG, PNG, and TIFF, and to signals transiting through video cables.
Calibrating the display
Many monitors, even recent ones, do not come properly calibrated by default. This is not a matter of gamma alone, and achieving a correct calibration normally requires a dedicated probe. But here in the context of astronomical imaging we will simply focus on contrast, brightness, and gamma adjustments.
If you want to check the gamma calibration of your display (monitor+video card), you must first make sure that a neutral transfer curve is selected in the monitor’s menu, and that the image sharpness settings are set to the most neutral position. . If your operating system supports ICC profiles, you might also want to install the ICC profile provided with your monitor (if it exists). ICC profiles are currently supported by the Safari v4+ and Firefox v3.5+ on the Windows and MacOS X platforms, and are especially important for screens with a colour gamut that differs significantly from that of the sRGB system. Note that in Firefox only graphics with colour management tags (overall a minority of all images on the web) are ICC-corrected by default. To apply your current system’s ICC profile to all images you might want to set gfx.color_management.mode to 1 in the about:config preference settings, as shown below (recommended only for displays with a native rendering not close to sRGB).
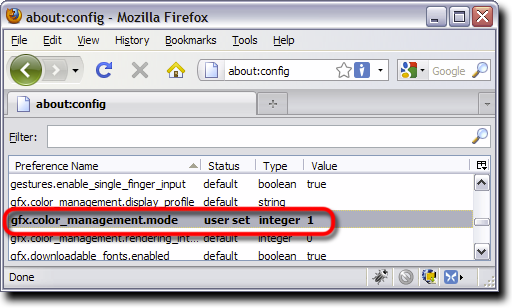
The next step consists of making sure that the monitor image controls are set appropriately, and that the extreme blacks and white levels are not clipped (see this test and this test). You are now ready to check on a gamma calibration pattern that your display gamma is close to the canonical value of 2.2. Other gamma check patterns can be found here or there. You may also create your own gamma calibration pattern yourself! Here is an example using MATLAB (and its Image Processing Toolbox):
h = 400;
g = 2.2;
[x,y] = meshgrid(1:w,1:h);
x = (x-1)/(w-1);
ymod = mod(y,2)*2–1;
y = (y-1)/(h-1);
ima = x;
ima(1:h/2,:) = 0.5*(1.0+ymod(1:h/2,:).*cosd(720.0*x(1:h/2,:))).*(y(1:h/2,:)*2).^2.0;
ima(h/2+1:h,:) = 1.0-ima(h/2:-1:1,:);
ima = ima.^(1/g);
colormap(gray)
imshow(ima,[]);
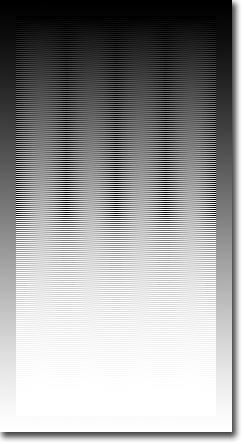 |
The pattern consists of interleaved sine waves with opposite sign. The interleaving is perpendicular to the video scan lines to minimize analog signals. The sum of the sine and its opposite is constant for all x and therefore such a pattern displayed on a screen with the proper gamma (the recommended sRGB default $\gamma = 2.2$) should appear uniform along the horizontal axis, over the whole luminosity range:
Vertical bands will appear if the display gamma is too low:
… or if it is too high:
|
Some monitors offer a gamma adjustment, but the best way to correct the display gamma is at the graphic card level. Graphic card drivers generally come with a colour correction interface where a gamma adjustment slider is present.
Perceptual image reproduction and astronomical image encoding
In practice, it is important to consider two factors that have a significant impact on the perception of reproduced images :
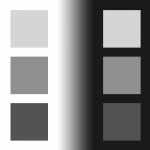 |
| Bartleson-Breneman effect: the series of squares on the right is identical to that on the left, but the perceived contrast between squares seems less because of the dark background. |
- Experimental studies have shown that the perceived “contrast” of an image is comparatively lower with a dim image surround compared to a bright surround (Bartleson & Breneman 1967): see illustration on the right. Now, contrary to real scenes or even printed images, images displayed on screens are usually watched in a relatively dim light environment; in such conditions a slightly exaggerated contrast will therefore result in a more natural-looking picture on a movie screen, a TV, or even a computer monitor.
- Screen glare/viewing flare: no screen displays a totally perfect black in typical viewing conditions. The amount of flare depends on the technology (set by the minimum monitor black level, or the maximum film density) and the environment (ambient light reflected on screen). The net effect of flare is to brighten the darkest areas of the displayed image.
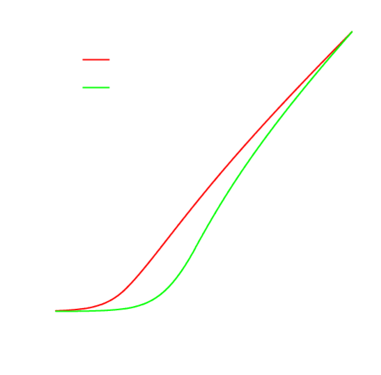
Recognizing the significance of these two factors, engineers have designed gamma compression laws slightly more complex than the simple $I^{1/\gamma}$ that would suffice to compensate for the power-law gamma expansion of (1). In other words, compensating for flare and the Bartleson-Breneman effect is done at the encoding level. The gamma compression model used for the sRGB (World Wide Web) and the ITU-R BT Rec.709 (High Definition TV) international standards is
| $$p\,(I) = \left\{\begin{array}{ll}a.I & \mbox{if } 0 \le I \lt I_t\\&\\(1+b).I^{1/\gamma} – b & \mbox{if } I_t \le I \le 1\end{array} \right.$$ | (2) |
|
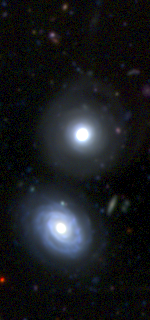
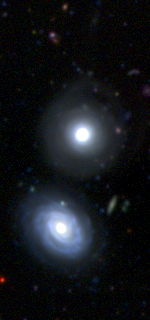
How do these perceptual corrections work with deep-sky astronomical images? Since deep sky images are mostly dark, and therefore operate in a different regime of the Bartleson-Breneman effect compared to “regular” images, we may wonder whether compensating simply for the standard 2.2 display gamma using $p(I) = I^{1/\gamma}$ is not the most appropriate choice. The answer depends on context and purpose. The sRGB curve, and even more notably the Rec.709 curve, have both a tendency to “bury” much of the dark tones of the image into a velvety black background. The figure below shows the same data encoded with three different gamma correction laws using STIFF 2.0. On a rather dark background like this page, and with low ambient lighting, we find sRGB-corrected images to provide the most visually-pleasing rendering of the data, with the linear part of the transfer curve helping to reduce the apparent contribution of noise. The power-law correction leads to slightly more washed out and noisy results, while the Rec.709 version looks excessively contrasty and wipes out the faintest galaxies. But when seen with a white surround (click on images) or a brighter ambient lighting, the power-law correction is the only one that keeps the faint details still well-visible, and becomes the best choice. The sRGB correction seems therefore to be more appropriate for illustration purposes when the image is to be displayed on a dark background, or when the sky is very “noisy”. The 0.45 power-law correction seems a better choice for brighter surrounds, display devices with a gamma higher than 2.2, or for scientific visualisation purposes where being able to see details in the background noise is important. |
 |
 |
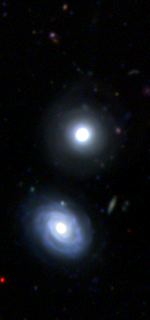 |
| 1/γ= 0.45 power law | sRGB | Rec. 709 |
Further reading
- H.-C. Lee 2005: Introduction to Color Imaging Science, Cambridge University Press
- M.C. Stone 2003: A Field Guide to Digital Color, A.K. Peters, Ltd
On the Web
- The STIFF homepage at AstrOmatic.net
- hardware.info monitor comparison page
- LCD monitor test page at lagom.nl
- Charles Poynton’s gamma FAQ
- Color context by S.Grais at DePaul University
- Modern color theory concepts and applications by B. MacEvoy at handprint.com
Understanding AstrOmatic metadata files
 |
Several AstrOmatic software packages (MissFITS, PSFEx, SCAMP, SExtractor, STIFF, SWarp and WeightWatcher) offer the possibility to generate metadata in XML-VOTable format at the end of an execution run. For this to happen, the configuration parameter WRITE_XML must be set to Y. The XML-VOTable format was chosen to facilitate integration in Virtual Observatory services, although it is somewhat cumbersome to use. |
Content of a metadata file
A metadata file consists essentially of a VOTable RESOURCE named “MetaData” containing several sections:
- a set of PARAM elements describing the execution run (date/time, user, path, etc.),
- a series of TABLEs containing various tool-dependent results, such as measurements, calibration results, statistics, …
- a “Warnings” TABLE listing all warnings issued during processing,with date and time of occurence,
- a “Config” sub-RESOURCE with all the configuration parameters and their values for the run, as well as the full command-line.
<?xml-stylesheet type="text/xsl" href="file:///usr/share/missfits/missfits.xsl"?>
<VOTABLE xmlns:xsi="http://www.w3.org/2001/XMLSchema-instance" xsi:noNamespaceSchemaLocation="http://www.ivoa.net/xml/VOTable/v1.1">
<DESCRIPTION>produced by MissFITS</DESCRIPTION>
<!– VOTable description at http://www.ivoa.net/Documents/latest/VOT.html –>
<RESOURCE ID="MissFITS" name="MissFITS">
<DESCRIPTION>Data related to MissFITS</DESCRIPTION>
<INFO name="QUERY_STATUS" value="OK" />
<RESOURCE ID="MetaData" name="MetaData">
<DESCRIPTION>MissFITS meta-data</DESCRIPTION>
<INFO name="QUERY_STATUS" value="OK" />
<PARAM name="Software" datatype="char" arraysize="*" ucd="meta.title;meta.software" value="MissFITS"/>
<PARAM name="Version" datatype="char" arraysize="*" ucd="meta.version;meta.software" value="2.2.11"/>
<PARAM name="Soft_URL" datatype="char" arraysize="*" ucd="meta.ref.url;meta.software" value="http:https://www.astromatic.net.iap.fr/software/missfits"/>
<PARAM name="Soft_Auth" datatype="char" arraysize="*" ucd="meta.bib.author;meta.software" value="Chiara Marmo,Emmanuel Bertin"/>
<PARAM name="Soft_Ref" datatype="char" arraysize="*" ucd="meta.bib.bibcode;meta.software" value="2006ASPC..351..112B"/>
<PARAM name="NThreads" datatype="int" ucd="meta.number;meta.software" value="1"/>
<PARAM name="Date" datatype="char" arraysize="*" ucd="time.event.end;meta.software" value="2009-09-25"/>
<PARAM name="Time" datatype="char" arraysize="*" ucd="time.event.end;meta.software" value="14:52:19"/>
<PARAM name="Duration" datatype="float" ucd="time.event;meta.software" value="1" unit="s"/>
<PARAM name="User" datatype="char" arraysize="*" ucd="meta.curation" value="bertin"/>
<PARAM name="Host" datatype="char" arraysize="*" ucd="meta.curation" value="kiravix.iap.fr"/>
<PARAM name="Path" datatype="char" arraysize="*" ucd="meta.dataset" value="/disk2/marquett"/>
<TABLE ID="OutFields" name="OutFields">
<DESCRIPTION>Metadata about the MissFITS</DESCRIPTION> output images
<PARAM name="NImages" datatype="int" ucd="meta.number;meta.dataset" value="1"/>
<FIELD name="Output_Image_Name" datatype="char" ucd="meta.id;meta.file;meta.fits"/>
<FIELD name="Input_Image_Type" datatype="char" ucd="meta;meta.code.class"/>
<FIELD name="Input_Extensions" datatype="int" ucd="meta.number;meta.dataset"/>
<FIELD name="Input_Naxis3" datatype="int" ucd="meta.number;meta.dataset"/>
<FIELD name="Output_Image_Type" datatype="char" ucd="meta;meta.code.class"/>
<FIELD name="Output_Extensions" datatype="int" ucd="meta.number;meta.dataset"/>
<FIELD name="Output_Naxis3" datatype="int" ucd="meta.number;meta.dataset"/>
<FIELD name="HeadFlag" datatype="boolean" ucd="meta.code;obs.param"/>
<FIELD name="OBJECT" datatype="char" ucd="meta;meta.note"/>
<DATA><TABLEDATA>
<TR>
<TD>temp.miss.fits</TD><TD>SPLIT</TD><TD>1</TD><TD>1</TD>
<TD>MULTI</TD><TD>8</TD><TD>1</TD><TD>F</TD>
<TD>centre gal</TD>
</TR>
</TABLEDATA></DATA>
</TABLE>
<TABLE ID="Warnings" name="Warnings">
<DESCRIPTION>MissFITS warnings (limited to the last 1000)</DESCRIPTION>
<FIELD name="Date" datatype="char" arraysize="*" ucd="meta;time.event.end"/>
<FIELD name="Time" datatype="char" arraysize="*" ucd="meta;time.event.end"/>
<FIELD name="Msg" datatype="char" arraysize="*" ucd="meta"/>
<DATA><TABLEDATA>
<TR><TD>2009-09-25</TD><TD>14:52:18</TD><TD>default.missfits not found, using internal defaults</TD></TR>
</TABLEDATA></DATA>
</TABLE>
<RESOURCE ID="Config" name="Config">
<DESCRIPTION>MissFITS configuration</DESCRIPTION>
<PARAM name="Command_Line" datatype="char" arraysize="*" ucd="obs.param" value="missfits -OUTFILE_TYPE MULTI -SAVE_TYPE NEW temp"/>
<PARAM name="Prefs_Name" datatype="char" arraysize="*" ucd="obs.param;meta.file" value="default.missfits"/>
<PARAM name="Remove_Keyword" datatype="char" arraysize="*" ucd=" " value=""/>
<PARAM name="Replace_Keyword" datatype="char" arraysize="*" ucd=" " value=""/>
<PARAM name="Slice_Keyword" datatype="char" arraysize="*" ucd=" " value=""/>
<PARAM name="SliceKey_Format" datatype="char" arraysize="*" ucd=" " value="%02d"/>
<PARAM name="Display_Keyword" datatype="char" arraysize="*" ucd=" " value="OBJECT"/>
<PARAM name="Header_Suffix" datatype="char" arraysize="*" ucd=" " value=".head"/>
<PARAM name="NExtensions_Min" datatype="int" ucd=" " value="0"/>
<PARAM name="OutFile_Type" datatype="char" arraysize="*" ucd=" " value="MULTI"/>
<PARAM name="Split_Suffix" datatype="char" arraysize="*" ucd=" " value=".%02d.fits"/>
<PARAM name="Slice_Suffix" datatype="char" arraysize="*" ucd=" " value=".%02d.fits"/>
<PARAM name="Process_Type" datatype="char" arraysize="*" ucd="meta.id;meta.code" value="NONE"/>
<PARAM name="Checksum_Type" datatype="char" arraysize="*" ucd="meta.id;meta.code" value="NONE"/>
<PARAM name="Save_Type" datatype="char" arraysize="*" ucd="meta.id;meta.code" value="NEW"/>
<PARAM name="New_Suffix" datatype="char" arraysize="*" ucd="meta.id;meta.code" value=".miss"/>
<PARAM name="Verbose_Type" datatype="char" arraysize="*" ucd="meta.code" value="NORMAL"/>
<PARAM name="Write_XML" datatype="boolean" ucd="meta.code" value="T"/>
<PARAM name="NThreads" datatype="int" ucd="meta.number;meta.software" value="1"/>
</RESOURCE>
</RESOURCE>
</RESOURCE>
Note that the medata file is written even if an error occurs, in which case a PARAM element named “Error_Msg” is added in the first section. In the case of SExtractor, the metadata is included in the output catalogue, together with the full list of extracted source measurements, if CATALOG_TYPE is set to ASCII_VOTABLE.
Accessing the metadata file content
The content of a metadata file can be parsed and read by VOTable-compliant VO tools and libraries, such as TOPCAT or the libVOTable. But as any other XML document, it can also be “translated” into another (more user-friendly) format using an XSLT stylesheet. The URL of an XSLT stylesheet must be specified at the beginning of XML file using the ?xml-stylesheet start-tag.
Every AstrOmatic software package that writes metadata VOTables comes with its own XSLT stylesheet, installed by default in /usr/share/<software_name>/ or /usr/local/share/<software_name>/ (the URL in the example above is file:///usr/share/missfits/missfits.xsl, it can be changed using the XSL_URL software configuration parameter, or obviously by hand directly in the metadata file). This XSLT stylesheet contains all the information needed to convert the metadata VOTable to plain old, eye-friendly XHTML. The result can be visualized by pointing your favorite web browser to the metadata file, either locally (e.g. in the example above file://missfits.xml) or remotely (e.g. https://www.astromatic.net/missfits.xml). Tables are expandable and rows are sortable by clicking on the header cells, thanks to a small JavaScript code (see below).
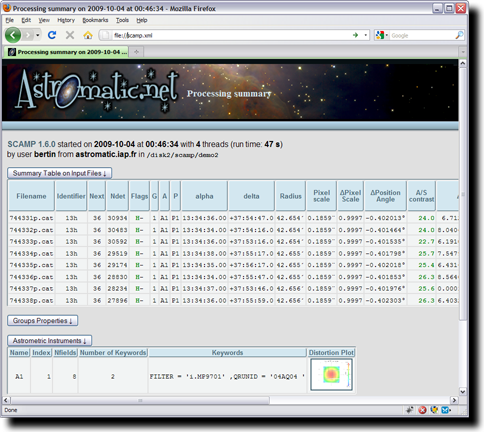 |
An XML-VOTable metadata file generated with SCAMP and visualized in the Firefox web browser. Click on the image to view a real example. |
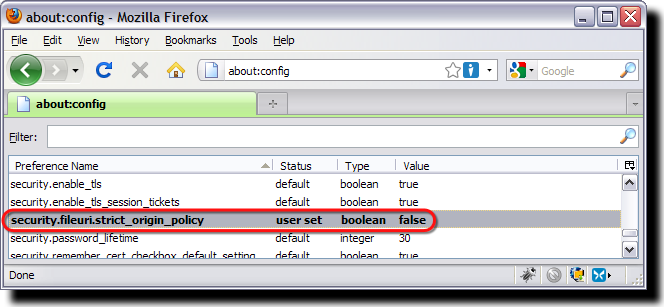
Be warned that since its version 3, the Firefox browser blocks by default access to XSLT stylesheets not located in the same directory as the XML file (among other things). A consequence on Linux is that the shell command firefox scamp.xml will return only an unformatted page with “flat” text, by default. This behaviour may be overridden in Firefox by changing the flag security.fileuri.strict_origin_policy to false in the about:config preference settings, as shown below.
References
Bertin, E. & Tissier, G. 2007: VOTables in TERAPIX Software, ASP Conference Series, Vol. 376, 2007, Richard A. Shaw, Frank Hill and David J. Bell., eds, p.507 [PDF] [BibTeX entry].
Playing the weighting game (I)

In real science images, pixels do not all exhibit identical statistical properties. Some pixels are noisier than others; it may be an intrinsic property, or the result of a gain correction (in vignetted image regions for instance). Some have glitches, are simply unreliable, saturated, or even missing.
Although the FITS standard offers the possibility to tag “bad” pixels (using the BLANK header keyword or NaN image values), it was soon realised that such a description was not adequate enough for processing imaging surveys with variable depth and noise level. Hence came the idea of associating to every science image a weight-map with identical dimensions. The value of a weight-map pixel is an estimate of the precision of the measurement provided by the related science image pixel. This representation has proven to be convenient but is still incomplete. As we shall now see, caution must be taken in using weight-maps.
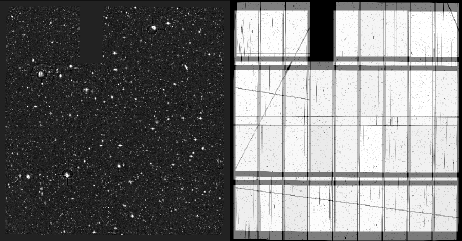 |
| A stacked image (left) and the associated composite weight-map (right). This was obtained by running SWarp on a set of exposures from the MEGACAM mosaic camera and custom-made weight-maps where bad columns, cosmic-ray impacts, CCD saturation bleeds and satellite trails were give zero weight. The final weight-map provides an accurate chart of the relative background noise level (in terms of inverse variance) to expect in the various parts of the stacked image. From Erben et al. (2009). |
Scaling weights
Weights are most conveniently expressed in units of relative inverse variance:
| $$w_j \propto \frac{1}{\sigma_j^2}$$ | (1) |
A higher weight indicates a lower noise, whereas a weight of 0 translates into infinite variance, and is appropriate for marking a pixel as “bad”. By using relative weights, one can rescale the flux of the science image without having to touch the weight-maps. Software such as SExtractor and SWarp internally calibrate the weight-maps they read and translate them into “absolute” variance maps using a low-resolution noise map derived from the science data themselves. This supposes that the noise process behaves ergodically and that its true variance can be measured at least locally in some parts of the image. The scaling works generally well, but may fail in the most crowded star fields, where no or very little sky background free of objects is available to measure image noise. In those cases a safer approach is to use RMS (root mean square) or variance maps, for which no rescaling is done inside the software.
Handling photon noise
Photon noise is often the main source of noise in modern imagers, and as such has a major influence on the weight-map content. Photon noise follows the Poisson law and variance is proportional to flux. For a sky-noise limited exposure, it may thus sound like a good idea to use the inverse of the image as a weight-map (or the image itself divided by the gain in e–/ADU as a variance map). Noise is seldom stationary because photon flux from bright sources generates additional variance locally. Weight-maps made of image inverses correctly take into account this fact, and could in principle be used to estimate photometric uncertainties, as in SExtractor (we neglect the effect of using “noisy weight-maps” instead of the expected values).
Using weights for combining images
However, such weight-maps would have to be handled with great care if they were to be used for weighted image combination, as in SWarp. As a matter of fact, in SWarp, the weighted combination of N input images can be written as
| $$p’_j=\frac{ \sum_{i\le N} w_{ij} p_{ij}}{\sum_{i \le N} w_{ij}},$$ | (2) |
where $p_{ij}$ and $w_{ij}$ are respectively the value and the weight of image i for pixel j.
The expected flux from the combined data, within an aperture A centred on a source then writes
| $$f_c =E\,(\sum_{j\subset A }p’_j) = E\,\left(\sum_{j\subset A} \frac{\sum_{i\le N} w_{ij} p_{ij}}{\sum_{i\le N} w_{ij}}\right) = \sum_{j\subset A} \frac{\sum_{i\le N} w_{ij} E(p_{ij})}{\sum_{i\le N} w_{ij}},$$ | (3) |
where E () is the expectation operator. Now let’s assume that all input images have the same zero point, and that the aperture A is large enough to contain all the source flux in all images, that is, $\sum_{j\subset A} E(p_{ij}) = f = cste \;\;\forall i$. One easily checks that the weighted combination conserves flux ($f_c=f$) only if
- $w_{ij}$ does not depend on i (input image), or
- $E(p_{ij})$ does not depend on i (same source profile in all input images), or
- $w_{ij}$ does not depend on j (weights are constant within the aperture).
Option (1) weights all input images identically and is therefore useless. (2) only applies in practice if the point-spread function (PSF) is rigorously the same on all images — and if the sky background is also the same or has been subtracted—. Perfectly stable PSFs are seldom seen in practice. Hence unless the PSF has been homogenised on all images we are therefore left with option (3): weight-maps should stay constant within the photometric aperture, or at least in the immediate vicinity of the “cores” of source profiles, where the profile may vary significantly from exposure to exposure. Flux is not conserved in other cases; and using the inverse of input images as weight-maps for instance leads to a strong magnitude-dependent bias in the combined image (illustration below).
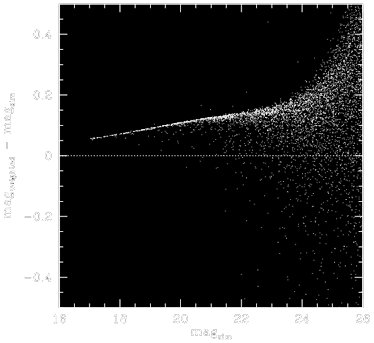 |
Difference between true and recovered stellar aperture magnitude as a function of true magnitude for a weighted combination of 9 simulated images with point-source full-width-at-half-maximum ranging from 2.5 to 5 pixels, when inverse image pixel values are used as weight-maps. Note the strong magnitude-dependent bias. |
This is why AstrOmatic software expects the global envelope of weight or variance maps to concern only the background noise (due to sky background photon statistics and/or read-out noise), as background noise is expected to change little on scale of the seeing disk. For sky background noise-limited images, a flat-field may be used as a weight-map (if there are multiple readout ports, the corresponding image regions should have their gains homogenised first). A weighted combination using these weight-maps is no longer optimal for bright sources, but the degradation should generally be very small in practice; the only case where it is significant is for combinations involving very different exposure times.
Weights in SExtractor
SExtractor uses weight-maps not-only to modulate the detection threshold over the image, but also to estimate measurement uncertainties, for which one can’t afford ignoring the noise from the source photons themselves, at least for bright sources. With “flat” weight-maps, SExtractor has to rely on the image itself, assuming prior knowledge of the gain. For example, the 1-σ uncertainty for a flux measurement in aperture A is computed as:
| $$\sigma_A^2 = \sum_{j\subset A} \left(\sigma_j^2 + \frac{f_j}{g_j}\right),$$ | (4) |
where $\sigma_j^2$ is the variance of the background noise at pixel j derived from the weight-map, $f_j$ the pixel value above the local background (in ADUs), and $g_j$ the pixel gain (in e-/ADU). The user can decide whether the gain $g_j$ should be kept fixed, or if it should be made proportional to the local weight (configuration option WEIGHT_GAIN Y), as when background noise variations are due to flat-field corrections. In that case, it is assumed that the value for the gain in the configuration file or in the image header corresponds to the median weight in the image.
… to be continued (noise correlation, etc.).
See Saturn as Galileo did!
Altissimum planetam tergeminum observavi («I saw the most distant planet triple-bodied») wrote Galileo about his observations of Saturn in 1610. How could he initially come to such a conclusion? Failure to distinguish the rings is generally attributed to the limited image quality of his telescope at the time. But searching on the web, I found illustrations intended to demonstrate this optical illusion unconvincing, and thought a more plausible simulation could be done.
 Using Celestia I generated an RGB colour image of Saturn seen from Earth at the end of July 1610. The angular equatorial diameter of Saturn was then 18.8″. Pixels in the full image measure 0.145″×0.145″.
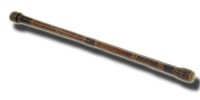 Galileo observed Saturn probably with a telescope like the one shown on the left, for which the effective aperture diameter is about 15mm (the objective diameter is 37mm, but the aperture is reduced with a cardboard diaphragm to reduce the amount of optical aberrations).
 Assuming the seeing disk full-width at half-maximum was 2″ during the observations, the corresponding point spread function (PSF) can be easily simulated with Skymaker for the three visual bands (red, green, blue).
IMAGE_SIZE 512 # Width,[height] of the output frame
IMAGE_TYPE PSF_FULLRES # PUPIL_REAL,PUPIL_IMAGINARY,PUPIL_MODULUS,
# PUPIL_PHASE,PUPIL_MTF,PSF_MTF,PSF_FULLRES,
# PSF_FINALRES,SKY_NONOISE,SKY,GRID
# or GRID_NONOISE
PIXEL_SIZE 0.145 # Pixel size in arcsec.
SEEING_FWHM 2.0 # FWHM of seeing in arcsec (incl. motion)
PSF_OVERSAMP 1 # Oversampling factor / final resolution
M1_DIAMETER 0.015 # Diameter of the primary mirror (in meters)
M2_DIAMETER 0.0 # Obstruction diam. from the 2nd mirror in m.
ARM_COUNT 0 # Number of spider arms (0 = none)
WAVELENGTH 0.45 # Average wavelength analysed (microns)
p(:,:,1) = double(imread(‘psf_r.fits’));
p(:,:,2) = double(imread(‘psf_v.fits’));
p(:,:,3) = double(imread(‘psf_b.fits’));
a2 = zeros(2048,2048,3);
p2 = zeros(2048,2048,3);
a2((2048–824)/2+1:(2048+824)/2,(2048–1440)/2+1:(2048+1440)/2,:) = a.^2.2;
p2((2048–1024)/2+1:(2048+1024)/2,(2048–1024)/2+1:(2048+1024)/2,:) = p;
b2 = ifft2(fft2(a2).*fft2(fftshift(p2)));
b = abs(b2((2048–768)/2+1:(2048+768)/2,(2048–768)/2+1:(2048+768)/2,:)).^0.45;
imwrite(uint8(b),‘saturnc.png’);
 The result (shown on the right) should be a good approximation of what Galileo must have seen in 1610. Despite the blurring, the first null of the Airy pattern provides a clear separation between the planet disk and the ring ansae, increasing the impression of a triple system.
About AstrOmatic software packages
 |
AstrOmatic software (formerly part of TERAPIX software) is meant to be portable. The main code is written in ANSI C, system function calls conform to POSIX, and the build system relies on GNU Autotools. |
Source packages
Source packages are available on the AstrOmatic GitHub repositories. On UN*X systems, all is needed to compile and install the source code is
./autogen.sh
./configure
make
sudo make install
The configure step can be customized using configure options (type configure –help for a list of options).
Binary packages
Modern operating system distributions come with binary package management tools to install binary packages and handle possible inter-package dependencies. The RPM system is available for most Linux distributions and makes for instance the installation/update of SExtractor as simple as:
sudo rpm -U sextractor-2.8.6-1.x86_64.rpm
In some cases, you may have to add the –force and –nodeps options to the command above. Linux users who have installed RPM binary releases of AstrOmatic software may have noticed that they are packaged differently from older (TERAPIX) releases. Here are the main changes:
- The installation root path for binaries and data is now the /usr/ instead of /usr/local/, as for regular Linux distribution packages.
- All executables are now dynamically linked with common system libraries (libc, libpthread). Linking with the PLplot library is now dynamic as well, which means that the PLplot package must be installed for running AstrOmatic software that depends on it (e.g. SCAMP). Most Linux distributions include binary versions of PLplot now; but if you intend to produce large quantities of plots in PNG format I strongly suggest you install PLplot from the source code, and turn on the basic gd-based PNG driver in the PLplot configuration (unfortunately the gd-based PNG driver is deactivated in recent binary releases of PLplot, and as a consequence some plots take >10× more time to complete).
- Linking with the ATLAS and FFTW libraries is still static; installing these libraries is therefore not required to operate AstrOmatic software. But this sets some minimum requirements on the processor’s instruction set, especially SIMD instructions (you may need to recompile the source code to run on older processors):
- 32 bit x86 processors: INTEL Pentium IV processors (2001) or later, AMD Athlon 64 processors (2003) or later (SSE2 instructions)
- 64 bit x86-64 processors: AMD Athlon 64 90nm processors (2005) or later, INTEL Pentium D (2005) or later (SSE3 instructions). Note that first generation Athlon64s (130nm process) are not compatible.
- Current RPMs are compiled on a Fedora 9 Linux system, and should be compatible with most Linux distributions released from 2006 till now. They are optimized for machines with an INTEL Core2 architecture, and up to 8 processor cores.
Is it better to install from the source or from the binary package?
The honest answer is: it depends.- On the one hand, building from the source distribution is not always the most convenient and efficient way to install software. Most problems occur because of external libraries. A growing number of AstrOmatic packages (currently PSFEx, SCAMP, SExtractor and SkyMaker) rely on external libraries, such as ATLAS or FFTW. Although the development versions of these libraries can themselves be compiled and installed from their source code, experience shows that configuration and compilation is often a lengthy (up to several hours for ATLAS!) and frustrating process. Basically, if the AstrOmatic binary package you installed works reliably, and does it fast enough for you, then you’re done.
- On the other hand, installing from the source package makes it possible to tune up the configuration (number of threads, library versions). It may be the only available option if your system is not compatible with the precompiled binary releases (e.g. too old, or too recent), or if you want to run unstable versions from the AstrOmatic SubVersion repositories. However, on x86 systems, compiling the code yourself may lead to slower executables if you don’t have the INTEL C compiler (icc). The reason is that icc is able to vectorise code that gcc can’t, like transcendental functions in loops. The gain in speed can be as much as 4× in some parts of the code. By default, all AstrOmatic binary packages are compiled using icc. If you decide to compile the source code of an AstrOmatic package that depends on the ATLAS and/or FFTW external libraries, I strongly suggest you also install these libraries from the source code, and do not rely on pre-compiled binaries. This will allow these packages to be optimized for your computer architecture (e.g., number of threads in ATLAS), and take advantage of specific processor features (instruction set, number of registers, cache size).


 with $\gamma = 2.4$, $a = 12.92$, $b = 0.055$, $I_t = 0.00304$